Your finances in real time, no manual reports
Inflows, outflows, net balance and month-end projection in one panel. Cash flow chart, category ranking and upcoming due dates — updated on every access.
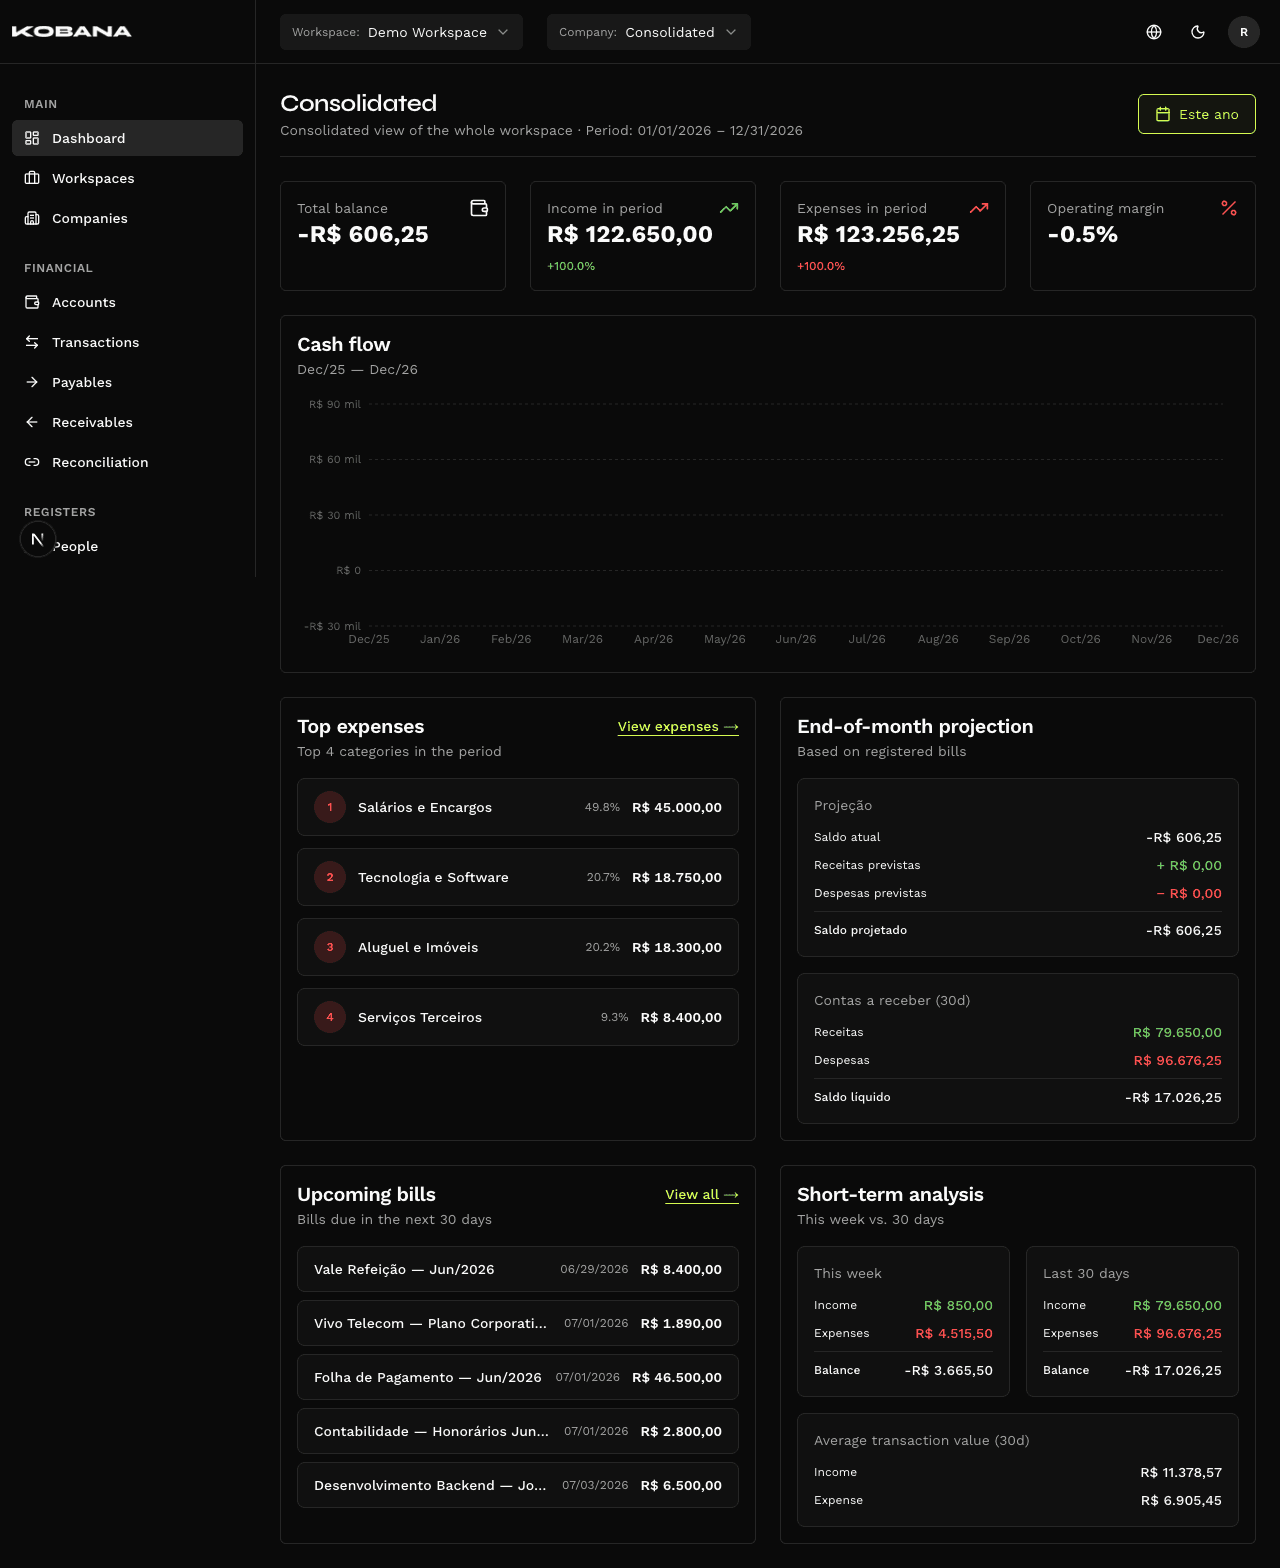
Everything you need to see without opening a single report
- Based on actual settlement date
- Comparison with previous period
- Filter by company or consolidated
- Based on actual payment date
- Separates payments from transfers
- Category drill-down available
- Automatic period calculation
- Color visual (positive/negative)
- No rounding
- Sum of all workspace accounts
- Real-time calculation (no sync delay)
- Account drill-down available
- Considers all entries due this month
- Updates as new charges are registered
- Displayed per company and consolidated
- Configurable grouping (day/week/month)
- Distinct colors for inflows and outflows
- Hover with exact values
- Percentage and absolute value
- By selected period
- Click to see category entries
- Overdue, due this week, due in 30 days
- Separated by payable and receivable
- Direct link to the entry
The number you see is the real number
Most financial platforms store balance as a field — and update periodically. When an entry is created while synchronization is pending, the balance is wrong until the next run.
In Smart Finance, each account balance is calculated via SQL CTE on every query. No stored field. No synchronization. The number the dashboard shows is exactly the sum of all account transactions up to that moment.
No Drift
Create an entry now. Reload the dashboard. The balance already reflects the change.
No Balance-Difference Reconciliation
If the balance differs from the statement, it's because there's a real transaction that wasn't recorded — not a sync bug.
Manual Adjustment with Audit
Need to adjust a starting balance? The adjustment is recorded with date, amount, responsible and reason. Nothing disappears.
Frequently asked questions
Real-time finances, no auxiliary spreadsheet
See in practice how the dashboard, month-end projection and calculated balance work for your company's structure.